Profit More, Risk Less: Trading Made Easy

Profit More, Risk Less: Trading Made Easy

Take full control of your trading decisions with BotJok.com’s Automated Trading Assistants! Our AI-powered ATA’s provide fast and accurate responses to market conditions, allowing you to seize opportunities with ease.

Start for Free
Profit More, Risk Less: Trading Made Easy

Problem

Trying to stay on top of market conditions can be time consuming and difficult.

Solution

BotJok.com's Automated Trading Assistants make it easy to track the markets and capitalize on opportunities quickly and accurately.

Action

Sign up for BotJok.com today and get started with our automated trading assistants for greater profits with less effort!

Academy

BotJok Trading Academy

Learning to trade can be a life-changing experience for those seeking financial independence. With the knowledge and skills acquired through our 6-week trading academy, you will have the potential to earn money and take control of your financial future.

Are you looking to get ahead investing in the markets?

BotJok.com ATA's Day Trading solutions can help you maximize returns and keep risk to a minimum. Advanced technologies are paired with expert traders for a complete package that offers unbeatable performance in all market conditions. Start your journey towards financial freedom today with the top-rated platform for Day Trading!

Automated Trading Assistant

Automated Trading Assistant

Introducing the future of trading – ATA (Automated Trading Assistants)! Say goodbye to the days of tirelessly analyzing market data and executing trades manually. With ATA, you can now take a back seat and let the power of automation work for you. Our cutting-edge technology uses advanced algorithms and machine learning to make strategic trades on your behalf, ensuring you stay ahead of the game. With 24/7 monitoring and lightning-fast execution, you’ll never miss out on a trading opportunity again. Whether you’re a seasoned trader or just starting out, ATA is the ultimate tool to take your trading to the next level. Say hello to your new trading partner, ATA!

Get Started

Automated Trading

Estimated account equity after your first full month
$1000 .00
Best Plan For You
Starter
My BotJok bot is crushing it! It is exciting to wake up to my bot closing profitable trades. Nothing better than earning while I sleep.
- James L
The bot strategy has been super effective! Even when the market moves the bot seem to find its way out of the trade in profit!
- Chris L
My bot has not lost a trade in over 100 trades! I have even used the strategy the bot uses to live trade and it works! Absolutely love it!
- Sam J

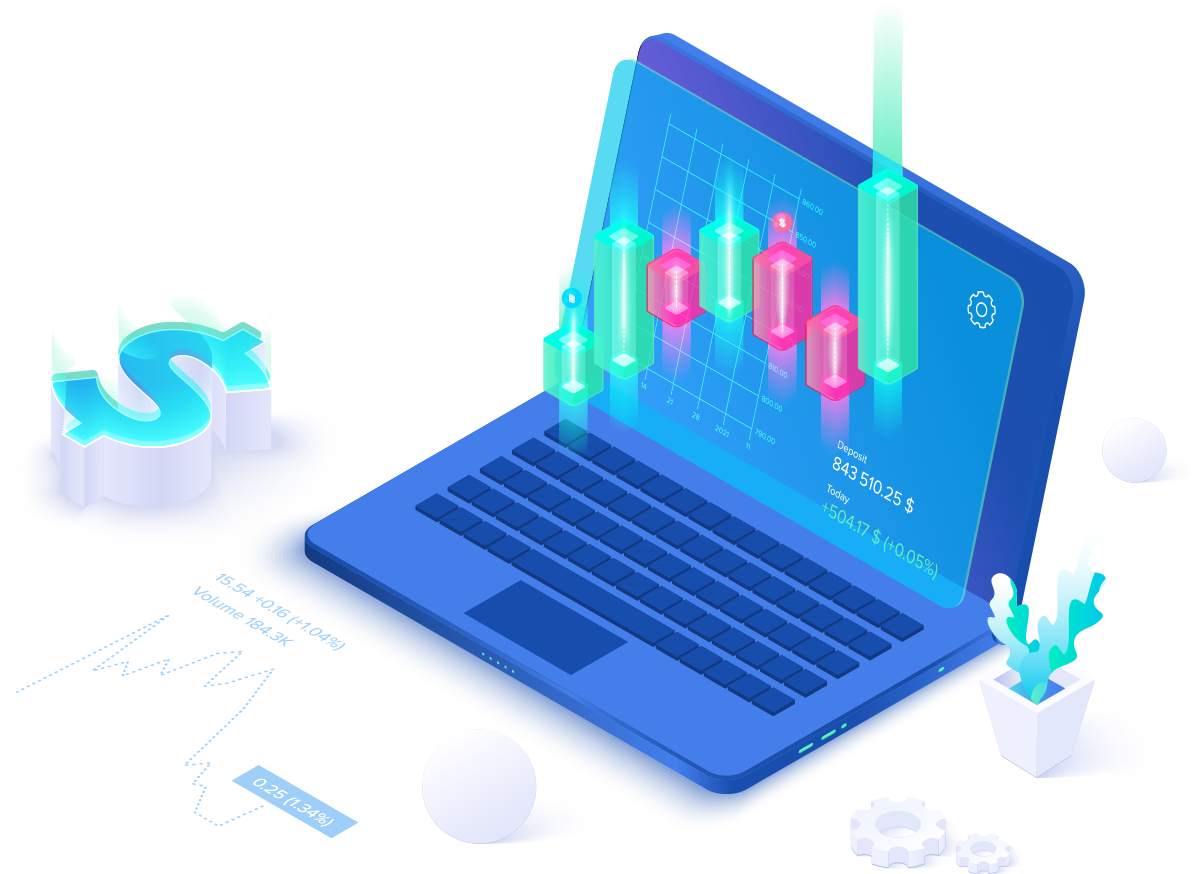
Choose From Our List of Advanced Indicators

Whether you’re a seasoned trader or just starting out, our Tradingview Indicators are the ultimate tool to take your skills to the next level! Our meticulously designed indicators and cutting-edge technology enable you to quickly and accurately identify market trends, giving you a competitive edge in the fast-paced trading environment. With lightning-fast execution times and easy-to-read charts, making informed decisions has never been easier. Our platform is fully customizable to fit your unique trading style, ensuring maximum efficiency and profitability. Join the ranks of elite traders who rely on our Tradingview Indicators to stay ahead of the game. Whether you’re an advanced trader or just starting out, our platform is designed to help you unlock your full trading potential. Sign up today and start revolutionizing your trading strategy!

Get Started

Popular Winning Indicators

Choose any of our customized Trading View indicators that help you learn how to trade.

RANK#1

BotJok Harmonic Tracker

BotJok Harmonic Tracker - the ultimate tool for identifying harmonic patterns in real-time! Harmonic patterns are used by some of the most powerful industries in the business, and now you can have the power to trade them too! Our advanced indicator not only allows you to identify these patterns, but it also displays green and red lines to show order blocks for support and resistance. And if that wasn't enough, our buy/sell signals give you confirmation as the harmonic pattern appears! With BotJok Harmonic Tracker, you'll be able to make informed decisions and capitalize on trading opportunities like never before. Don't miss out on this game-changing tool.

RANK#2

BotJok Bollinger Tracker

BotJok Bollinger Tracker! Our advanced tool is designed to help you identify sharp, short-term price movements and potential entry and exit points, so you can make informed trading decisions. With flexible and visually intuitive Bollinger Bands, you can easily analyze the market trends and stay ahead of the game. Plus, our innovative color-coded bands and diamond fractals will keep you on the right track and make it easy to spot potential breakouts. Whether you're a seasoned trader or just starting out, BotJok Bollinger Tracker is the perfect tool to unlock your full trading potential.

RANK#3

BotJok Divergence Hunter

BotJok Divergence Hunter will help you find divergence within the market. Divergence is one of the most difficult things for new traders to see. This indicator will be game changing for enhancing your trading ability. Our advanced coding allows you to gain an edge over other traders. Think of it like a crystal ball on where the market is going. Divergence can play out quickly or take several candles but it always plays out!

RANK#4

BotJok Zone Tracker

BotJok Zone Tracker will help you find your trading zone! With built in colors that give clear support and resistance zones. We added a bonus with our sun and skull signals. These signals will give you guidance during shifts in the market trend. This indicator works amazing along side of our Divergence Hunter.

RANK#5

BotJok Heatmap Trend

BotJok Heatmap Trend is the ideal indicator to stay on trend! Using our advanced algorithm this indicator will also display a green/red line with the trend to identify safe entries. Our unique symbols of a bear and star identify if the trend is showing bearish or bullish. Notice the candle colors change as the volume picks up. Increased volume after a confirmed trend helps make the perfect entry! All of these tools in one makes this indicator a must for your charts!

RANK#6

BotJok PSI Index

BotJok PSI Index is the ideal indicator to identify the squeeze the market makers love to play! Using our advanced algorithm this indicator will also display a green/red line with the trend to identify safe entries. Our symbols help you identify potential entries. If the line is grey it is a riskier trade zone. As the line breaks down you may have a potential entry. All of these tools in one makes this indicator a must for your charts!

RANK#7

BotJok Oscillation Scalper

BotJok Oscillation Scalper uses an advanced combination of indicators that will search for the bottom and top of the trend. This indicator is best used in market oscillations. It has a great visual of support and resistance as well as where you are in the range of oscillation.

Trade Your Favorite Coins With Our Buy/Sell Signals

Trade Your Favorite Coins With Our Buy/Sell Signals

Looking for a game-changing way to boost your day trading profits? Our advanced Buy Sell Signals Service is the answer! With state-of-the-art AI technology, you can confidently make informed investment decisions at lightning-fast speeds. Say goodbye to tedious data analysis and chasing trends. Our real-time signals and user-friendly platform make it easy for you to maximize profits and never miss out on a profitable trade again. Whether you’re a seasoned trader or just starting out, our Buy Sell Signals Service is the perfect tool to help you reach your full trading potential. Join the thousands of satisfied traders who have already discovered the benefits of our service. Sign up now and start revolutionizing your day trading strategy!

Get Started
Trade Your Favorite Coins With Our Buy/Sell Signals

Signals Performance on Historical Data

Customizable buy/sell notifications. Only receive notifications from the coins you wish to trade!

Leverage

BTC Signals

Leverage

ETH Signals

Leverage

ADA Signals

Leverage

DOGE Signals

Leverage

XRP Signals

Leverage

AVAX Signals

Leverage

ALGO Signals

Leverage

DOT Signals

Leverage

SOL Signals

Leverage

MATIC Signals

Leverage

SHIB Signals

Leverage

AAVE Signals

Leverage

HBAR Signals

Leverage

LTC Signals

Leverage

BTC Swing Signals

Leverage

ETH Swing Signals

Leverage

ADA Swing Signals

Leverage

DOGE Swing Signals

Leverage

XRP Swing Signals

Leverage

DOT Swing Signals

Leverage

AVAX Swing Signals

Leverage

ALGO Swing Signals

Leverage

SOL Swing Signals

Leverage

MATIC Swing Signals

Leverage

SHIB Swing Signals

Leverage

AAVE Swing Signals

Leverage

HBAR Swing Signals

Leverage

LTC Swing Signals

Spot

BTC Signals

Spot

ETH Signals

Spot

ADA Signals

Spot

DOGE Signals

Spot

XRP Signals

Spot

AVAX Signals

Spot

ALGO Signals

Spot

DOT Signals

Spot

SOL Signals

Spot

MATIC Signals

Spot

SHIB Signals

Spot

AAVE Signals

Spot

HBAR Signals

Spot

LTC Signals

Stock Leverage

SPY Stock Signals

Stock Leverage

QQQ Stock Signals

Stock Leverage

AAPL Stock Signals

Stock Leverage

AMZN Stock Signals

Stock Leverage

GOOGL Stock Signals

Stock Leverage

MSFT Stock Signals

Stock Leverage

META Stock Signals

Stock Leverage

TSLA Stock Signals

Stock Leverage

NFLX Stock Signals

Stock Leverage

NVDA Stock Signals

Stock Leverage

INTC Stock Signals

Stock Leverage

AMD Stock Signals

Stock Leverage

PYPL Stock Signals

Stock Leverage

COIN Stock Signals

Stock Leverage

PLTR Stock Signals

Advanced Use of Strategic Strategies

Our experience and advanced coding techniques use a large variety of trading tools to maximize profits. This has allowed us to perfect our automated trading assistant, indicators and signals.

Trend

Trend Tracking

A trend is the overall direction of a market or an asset's price. In technical analysis, trends are identified by trendlines or price action that highlight when the price is making higher swing highs and higher swing lows for an uptrend, or lower swing lows and lower swing highs for a downtrend.

Long

Support

In trading, support is like a floor for a stock price - it's the lowest point it usually gets to before bouncing back up. Traders tend to buy when a stock price reaches this point, which helps it stop dropping and start going up again.

Short

Resistance

Resistance, or a resistance level, is the price at which the price of an asset meets pressure on its way up by the emergence of a growing number of sellers who wish to sell at that price.

Trend

Bollinger Bands

Bollinger Bands are envelopes plotted at a standard deviation level above and below a simple moving average of the price. Because the distance of the bands is based on standard deviation, they adjust to volatility swings in the underlying price.

Trend

Fibonacci Retracement

Fibonacci retracement levels are horizontal lines that indicate the possible locations of support and resistance levels. Each level is associated with one of the above ratios or percentages. It shows how much of a prior move the price has retraced. The direction of the previous trend is likely to continue.

Strategy

Dollar Cost Averaging

Dollar-cost averaging (DCA) is an investment strategy in which an investor divides up the total amount to be invested across periodic purchases of a target asset in an effort to reduce the impact of volatility on the overall purchase. The purchases occur regardless of the asset's price and at regular intervals.

Protect

Take Profit

One of the most important pre-calculated price levels used by traders today is called Take Profit. This is a type of pending order that is placed to close a profitable position once the market reaches a specific price. As the name suggests, it allows the trader to set a predefined level to lock in any profits.

Protect

Stop Loss

A stop-loss order is an order placed with a broker to buy or sell a specific stock once the stock reaches a certain price. A stop-loss is designed to limit an investor's loss on a security position. For example, setting a stop-loss order for 10% below the price at which you bought the stock will limit your loss to 10%

Candle Progression

Doji

A Doji is a candlestick pattern that looks like a cross as the opening price and the closing prices are equal or almost the same. When looked at in isolation, a Doji indicates that neither the buyers nor sellers are gaining – it's a sign of indecision.

Candle Progression

Bullish Engulfing

A bullish engulfing pattern is a candlestick pattern that forms when a small red candlestick is followed the next day by a large green candlestick, the body of which completely overlaps or engulfs the body of the previous day's candlestick.

Candle Progression

Bearish Engulfing

A bearish engulfing pattern is a candlestick pattern that forms when a small green candlestick is followed the next day by a large red candlestick, the body of which completely overlaps or engulfs the body of the previous day's candlestick.

Candle Progression

Three White Soldiers

Three white soldiers is a bullish candlestick pattern that is used to predict the reversal of the current downtrend in a pricing chart. The pattern consists of three consecutive long-bodied candlesticks that open within the previous candle's real body and a close that exceeds the previous candle's high.

Candle Progression

Three Black Crows

Three black crows is a phrase used to describe a bearish candlestick pattern that may predict the reversal of an uptrend. Candlestick charts show the day's opening, high, low, and closing prices for a particular security. For stocks moving higher, the candlestick is white or green.

Candle Progression

Morning Star

Morning Star candlestick is a triple candlestick pattern that indicated bullish reversal. It is formed at the bottom of a downtrend and it gives us a warning sign that the ongoing downtrend is going to reverse.

Candle Progression

Evening Star

An evening star is a candlestick pattern used by technical analysts to predict future price reversals to the downside. Although it is rare, the evening star pattern is considered by traders to be a reliable technical indicator. The evening star is the opposite of the morning star pattern.

Candle Progression

Hammer

What Is a Hammer Candlestick? A hammer candlestick is a technical trading pattern that resembles a “T” whereby the price trend of a security will fall below its opening price, illustrating a long lower shadow, and then consequently reverse and close near its opening.

Candle Progression

Inverted Hammer

Inverted Hammer candlestick is a pattern that appears on a chart when there is a buyer's pressure for pushing the price of the stocks upwards. This is a reversal candlestick pattern that appears at the bottom of a downtrend and signals a potential bullish reversal.

Security is Our First Priority

Security is Our First Priority

At our website, we take security very seriously. We understand the importance of providing a secure environment for our users to browse and make transactions. That’s why we implement various security measures, such as SSL encryption, firewalls, and regular security audits. Our website is also constantly updated to ensure it is protected against the latest threats and vulnerabilities. By prioritizing security, we aim to provide a safe and trustworthy online experience for our users. When you browse our website, you can rest assured that your personal and financial information is protected. Trust us for a secure and reliable online experience.

Get Started
Security is Our First Priority

Support Exchanges

Binance US
Coinbase
KuCoin
Kraken Pro
Tastytrade

Start Your Journey Now!! Trade on a platform trusted by millions of users.

SIGN UP NOW